Good info. I think in time even here it catches up based on price increases and inflationary headwinds. If people are moving from higher cost areas and sold house at old city (at a very high price in comparison to our prices) they would be able to afford. But how will local buyers with less income afford the much higher prices. We did weather the last downturn well but prices weren’t spiked as much as now.
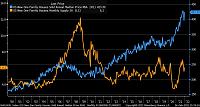
Here’s another chart over time, again its national amd not always reflective of OKC metro. Blue is medium price and orange is supply of houses. Chart is from 2000-current:


Originally Posted by DowntownMan


 Reply With Quote
Bookmarks